Share this article

It’s nice to talk about fundraising in the abstract and offer up best practices and tips for making the most of your fundraising techniques and tactics. But sometimes it helps to have some numbers and figures thrown in with the abstractions.
Having said that, we’ve taken a look at some fundraising statistics that we think are very interesting and deserve to be brought to your attention.
General Fundraising Statistics
Online Donation Statistics
Social Media Fundraising Statistics
Mobile Fundraising Statistics
Email Fundraising Statistics
Fundraising Event Statistics
Matching Gifts Statistics
Sources
Check out these amazing fundraising statistics.
General Fundraising Statistics
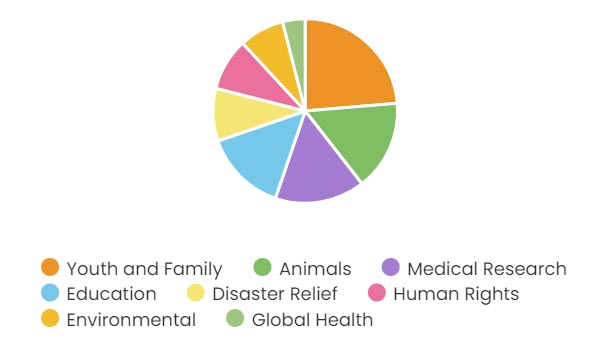
- 18% of Americans have said that supporting youth and family causes are most important to them.
- 12% said animals.
- 12% said medical research.
- 11% said education.
- 7% said disaster relief.
- 7% said human rights.
- 6% said the environment.
- 3% said global health.

- Men between the ages of 18 and 34 are more likely to make a charitable donation than any other group.
- 60% of millennials donate an average of $481 to nonprofits each year.
- Nearly three out of four young adults are willing to raise money on behalf of an organization that matters to them.
- The average American supports 4.5 charities.
- 69% of Americans give charitably.
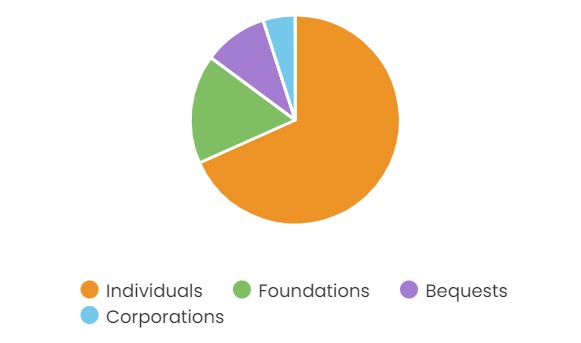
- 69% of all donations are made by individuals.
- 17% are made by foundations.
- 10% are made through bequests.
- 5% are made by corporations.

- Individuals that earn $25,000 or less donate the largest share (16.6%) of their income to charity.
- 12% of all giving happens in the last three days of the year.
- 35% of all giving happens in the last three months of the year.
- Monthly donors give 42% more in one year than one-time donors.
- 88% of dollars raised comes from 12% of an organization’s donors.
- Giving is projected to increase by 5.1% in 2021.
- Nonprofits process more donations between 10:00 p.m. and 11:00 p.m. EST than any other hour of the day.
- In 2019, religious organizations received the majority (29%) of the $449.64 billion dollars donated. Education organizations received the next highest percentage of total giving (14%).
- Almost half (45%) of donors participate in a monthly giving program.
Online Donation Statistics
- Online gifts made up roughly 13% of online gifts in 2020, up from 8.7% of total giving in 2019.
- Online donations made up 14.1% of all donations received by nonprofits earning less than one million dollars per year.
- Online giving grew 21 percent in 2020.
- 47% of donors over the age of 60 give online.
- Online donors aged 55 to 64 are the most generous crowdfunders
- 75% of young donors are turned off by out-of-date websites
- Donations made on a branded donation form are, on average, 38% larger than contributions made through a generic PayPal page
- Supporters are nearly 70% more likely to give a second donation if they used a branded page the first time they made a contribution.
- Online resources are considered 20% more useful than direct mail when it comes to influencing donors.
- 57% of people who watch nonprofit videos go on to make a donation.
- Donors are 34% more likely to give on responsive websites.
- 42% of traffic to nonprofit websites came from organic traffic in 2020.
- Search ads had the best ROI (return on investment) for nonprofits using paid advertising, with an average ROI of $4.78.
- For every 1,000 website visitors, a nonprofit raises $612.
- Online gifts across all nonprofit subsectors averages $148
- Mac users give an average of $182 per donation.
- PC users give an average of $137 per donation.
- Internet Explorer users give an average of $138 per donation.
- FireFox users give an average of $140 per donation.
- Chrome users give an average of $153 per donation.
- Safari users give an average of $168 per donation.
- Yahoo users give an average of $120 per donation.
Social Media Fundraising Statistics
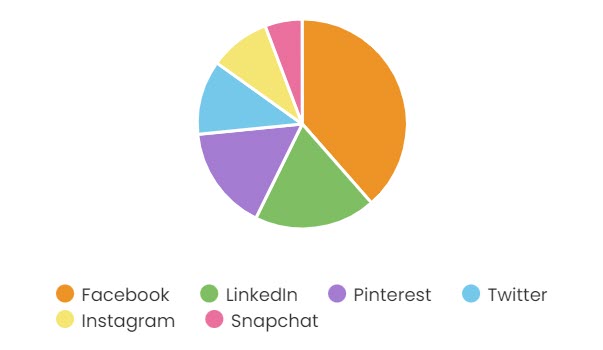
- 74% of American internet users are on Facebook.
- 36% are on LinkedIn.
- 31% are on Pinterest.
- 22% are on Twitter.
- 18% are on Instagram.
- 11% are on SnapChat.

- Since launching Facebook fundraising tools in 2015, Facebook fundraisers have raised more than $2 billion for nonprofits and personal causes.
- For nonprofits 1.3% of all online revenue came via Facebook fundraisers.
- Social media posts were the #1 drivers of charitable giving in 2020.
- There was a 14% increase in revenue from Facebook Fundraisers in 2020.
- 81.6% of donors look at your nonprofit website and your social media accounts first for updates on your organization
- The average ROI on social media ads was $1.05.
Mobile Fundraising Statistics
- Approximately 26% of all online giving was processed on mobile devices.
- 19.4% of nonprofit event registrations occur on mobile devices.
- 51% of people who visit a nonprofit’s website do so on a mobile device.
- Mobile-responsive donation pages yield 34% more donations.
- Apple devices like iPhones and iPads processed 80% of all mobile donations in past years.
- Text donors are most likely to be 49- to 59-years-old, married women who have college degrees.
- 41% of Americans don’t have a landline.
- 91% of Americans own a smartphone and look at them around 80 times a day.
- The average text-to-give donation is $102.65.
- 98% of text messages are opened within the first 5 minutes.
- Nonprofit text messaging audiences grew by 26% in 2020, the same percentage as in 2019.
- Calculate the ROI of text fundraising by using the statistics above. ROI = (Gain of investment – Cost of investment) / Cost of investment
- An example with Qgiv’s text fundraising package, which is $129/month, and the average text donation amount, $102.65. To achieve a 200% ROI for text fundraising, your nonprofit would need to raise $387.
- ($387 – $129) / $129 = 2
Email Fundraising Statistics
- Email has the highest return on investment of any marketing channel ($40 for every dollar spent!).
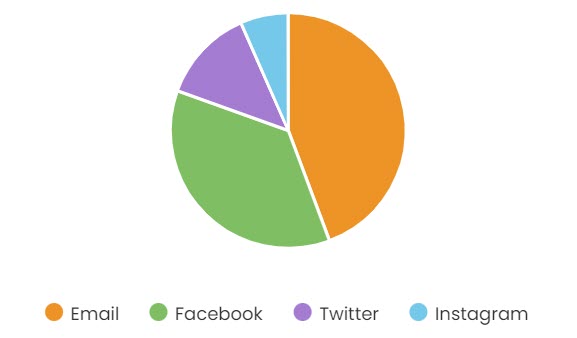
- For every 1,000 email subscribers, nonprofits have 817 Facebook fans, 291 Twitter followers, and 149 Instagram followers, up from 285 Facebook followers and 112 Twitter followers.

- 16.6% of donors who support from an email are doing so on a mobile device.
- Open rates for nonprofit emails is between 15% and 17.5%.
- 27% of nonprofits spend less than $1,000 of their budget on marketing a year.
- The average one-time gift from email fundraising is $57. The average monthly gift is $20.
- The dollar amount raised by 1,000 fundraising messages sent increased by 35% in 2020.
- The average response rate for an advocacy email rose 5% in 2020, while the response rate for fundraising emails grew 41% for the same time period.
- Unique/Corporate/Other email users give an average of $165 per donation.
- Gmail users give an average of $143 per donation.
- AOL users give an average of $138 per donation.
- Hotmail users give an average of $128 per donation.
Fundraising Event Statistics
- The mean donation on our peer-to-peer platform increased from $87.46 in 2019 to $108.62 in 2020.
- The retention rate for peer-to-peer fundraisers was 25.1% in 2019, but it dropped to 14.7% in 2020.
- While baby boomers are unlikely to engage in peer-to-peer fundraising, other generations are. In fact, 84% of Generation Z is open to becoming a fundraiser on behalf of your organization!
- 56% of donors regularly attend fundraising events.
- 69.9% of nonprofits plan to include some virtual elements in their fundraisers going forward. 23.7% plan to stick with virtual going forward.
Matching Gifts Statistics
- 65% of Fortune 500 companies offer a matching gifts program.
- Millennial donors are most likely to apply for a matching gift.
Final Thoughts
Keeping up to date with the latest fundraising research is a great way for your nonprofit to stay ahead and achieve your mission. If you haven’t already, check out Navigating the Unknown and get valuable insights from our most recent study, plus get well-thought-out action steps to help move your nonprofit in the right direction!
Sources
- Qgiv
- The Concord Leadership Group
- Nonprofit Tech for Good
- Double the Donation
- DonorSearch
- Giving USA 2020 Charitable Giving Trends
- Blackbaud Institute 2019 Charitable Giving Report
- Philanthropy Outlook Total Giving Projections
- Social Media Today Facebook Fundraiser Stats
- M+R Benchmarks 2020 Social Media Data and M+R Benchmarks 2021
You might enjoy

Client Spotlight: Pulmonary Fibrosis Foundation
Fundraising Ideas

How to Host a Giving Day: A Guide for Nonprofits
Fundraising Events